Subsetting grids using shapefiles.
[3]:
import pygeogrids.grids as grids
import pygeogrids.shapefile as shapefile
import numpy as np
import os
[4]:
testgrid = grids.genreg_grid(0.1, 0.1)
We can now subset the 0.1x0.1 degree regular grid with the shapefiles from http://biogeo.ucdavis.edu/data/gadm2.8/gadm28_levels.shp.zip which were downloaded/extracted to ~/Downloads/gadm
[11]:
austria = shapefile.get_gad_grid_points(
    testgrid, os.path.join('/home', os.environ['USER'], 'Downloads', 'gadm', 'gadm28_levels.shp.zip'), 0, name='Austria')
---------------------------------------------------------------------------
AttributeError                            Traceback (most recent call last)
<ipython-input-11-2af9cfcfb60c> in <module>
----> 1 austria = shapefile.get_gad_grid_points(
      2     testgrid, os.path.join('/home', os.environ['USER'], 'Downloads', 'gadm', 'gadm28_levels.shp.zip'), 0, name='Austria')

/shares/wpreimes/home/code/pygeogrids/src/pygeogrids/shapefile.py in get_gad_grid_points(grid, gadm_shp_path, level, name, oid)
     73         drv = ogr.GetDriverByName('ESRI Shapefile')
     74         ds_in = drv.Open(gadm_shp_path + 'gadm28_adm{:}.shp'.format(level))
---> 75         lyr_in = ds_in.GetLayer(0)
     76         if name:
     77             if level == 0:

AttributeError: 'NoneType' object has no attribute 'GetLayer'
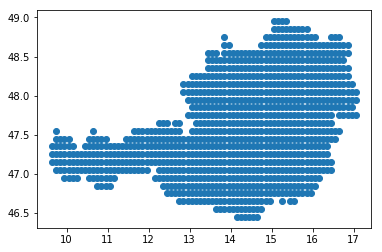
We can the plot the resulting grid using a simple scatterplot.
[41]:
import matplotlib.pyplot as plt
%matplotlib inline
plt.scatter(austria.arrlon, austria.arrlat)
[41]:
<matplotlib.collections.PathCollection at 0x7f654fc03b50>
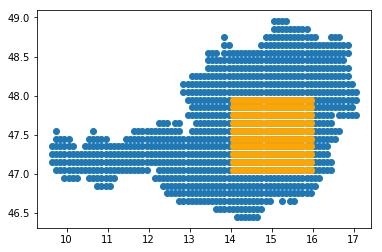
Behind the scenes this functionality uses the get_shp_grid_points function of the grid object.
We can also use this directly using any ogr.Geometry object.
[42]:
ring = ogr.Geometry(ogr.wkbLinearRing)
ring.AddPoint(14, 47)
ring.AddPoint(14, 48)
ring.AddPoint(16, 48)
ring.AddPoint(16, 47)
ring.AddPoint(14, 47)

poly = ogr.Geometry(ogr.wkbPolygon)
poly.AddGeometry(ring)
subgrid = austria.get_shp_grid_points(poly)
plt.scatter(austria.arrlon, austria.arrlat)
plt.scatter(subgrid.arrlon, subgrid.arrlat, c='orange')
[42]:
<matplotlib.collections.PathCollection at 0x7f654fd4f110>
[ ]: